1) Prepare data
import pandas as pd
import numpy as np

import os

import matplotlib.pyplot as plt
import matplotlib.patches as mpatches
import seaborn as sns
import missingno as msno
import warnings
warnings.filterwarnings('ignore')
pd.set_option('display.max_columns', None)
- We will use information collected during the stay of a patient in ICU to predict whether the patient will develop sepsis (0 for no sepsis and 1 for sepsis). The data consist of records from 21634 patients and has been split into a training set (with 15144 patients) and a test set (with 6490 patients). Outcomes are provided for the training set, and are withheld for the test set.
patient_1 = pd.read_csv("../data/x_all/1.txt")
patient_1
| Hour | Variable | Value | |
|---|---|---|---|
| 0 | 1 | Age | 50.73 |
| 1 | 1 | Gender | 1.00 |
| 2 | 1 | ID | 1.00 |
| 3 | 2 | Age | 50.73 |
| 4 | 2 | DBP | 51.31 |
| ... | ... | ... | ... |
| 131 | 17 | HR | 73.84 |
| 132 | 17 | MAP | 76.73 |
| 133 | 17 | O2Sat | 96.09 |
| 134 | 17 | Resp | 14.87 |
| 135 | 17 | SBP | 94.28 |
136 rows × 3 columns
patient_1.Variable.unique()
array(['Age', 'Gender', 'ID', 'DBP', 'HR', 'MAP', 'O2Sat', 'Resp', 'SBP',
       'Temp', 'BUN', 'Creatinine', 'Hct', 'Hgb', 'Magnesium',
       'Phosphate', 'Platelets', 'Potassium', 'WBC'], dtype=object)
- Approximately 40 variables were recorded at least once after the patient’s admission to the ICU.
- Each variable has an associated time-stamp indicating the elapsed time (in hours) of the measurement since ICU admission. Thus, for example, a time stamp of 3 means that the associated measurement was made 3 hours after the patient was admitted to the ICU.
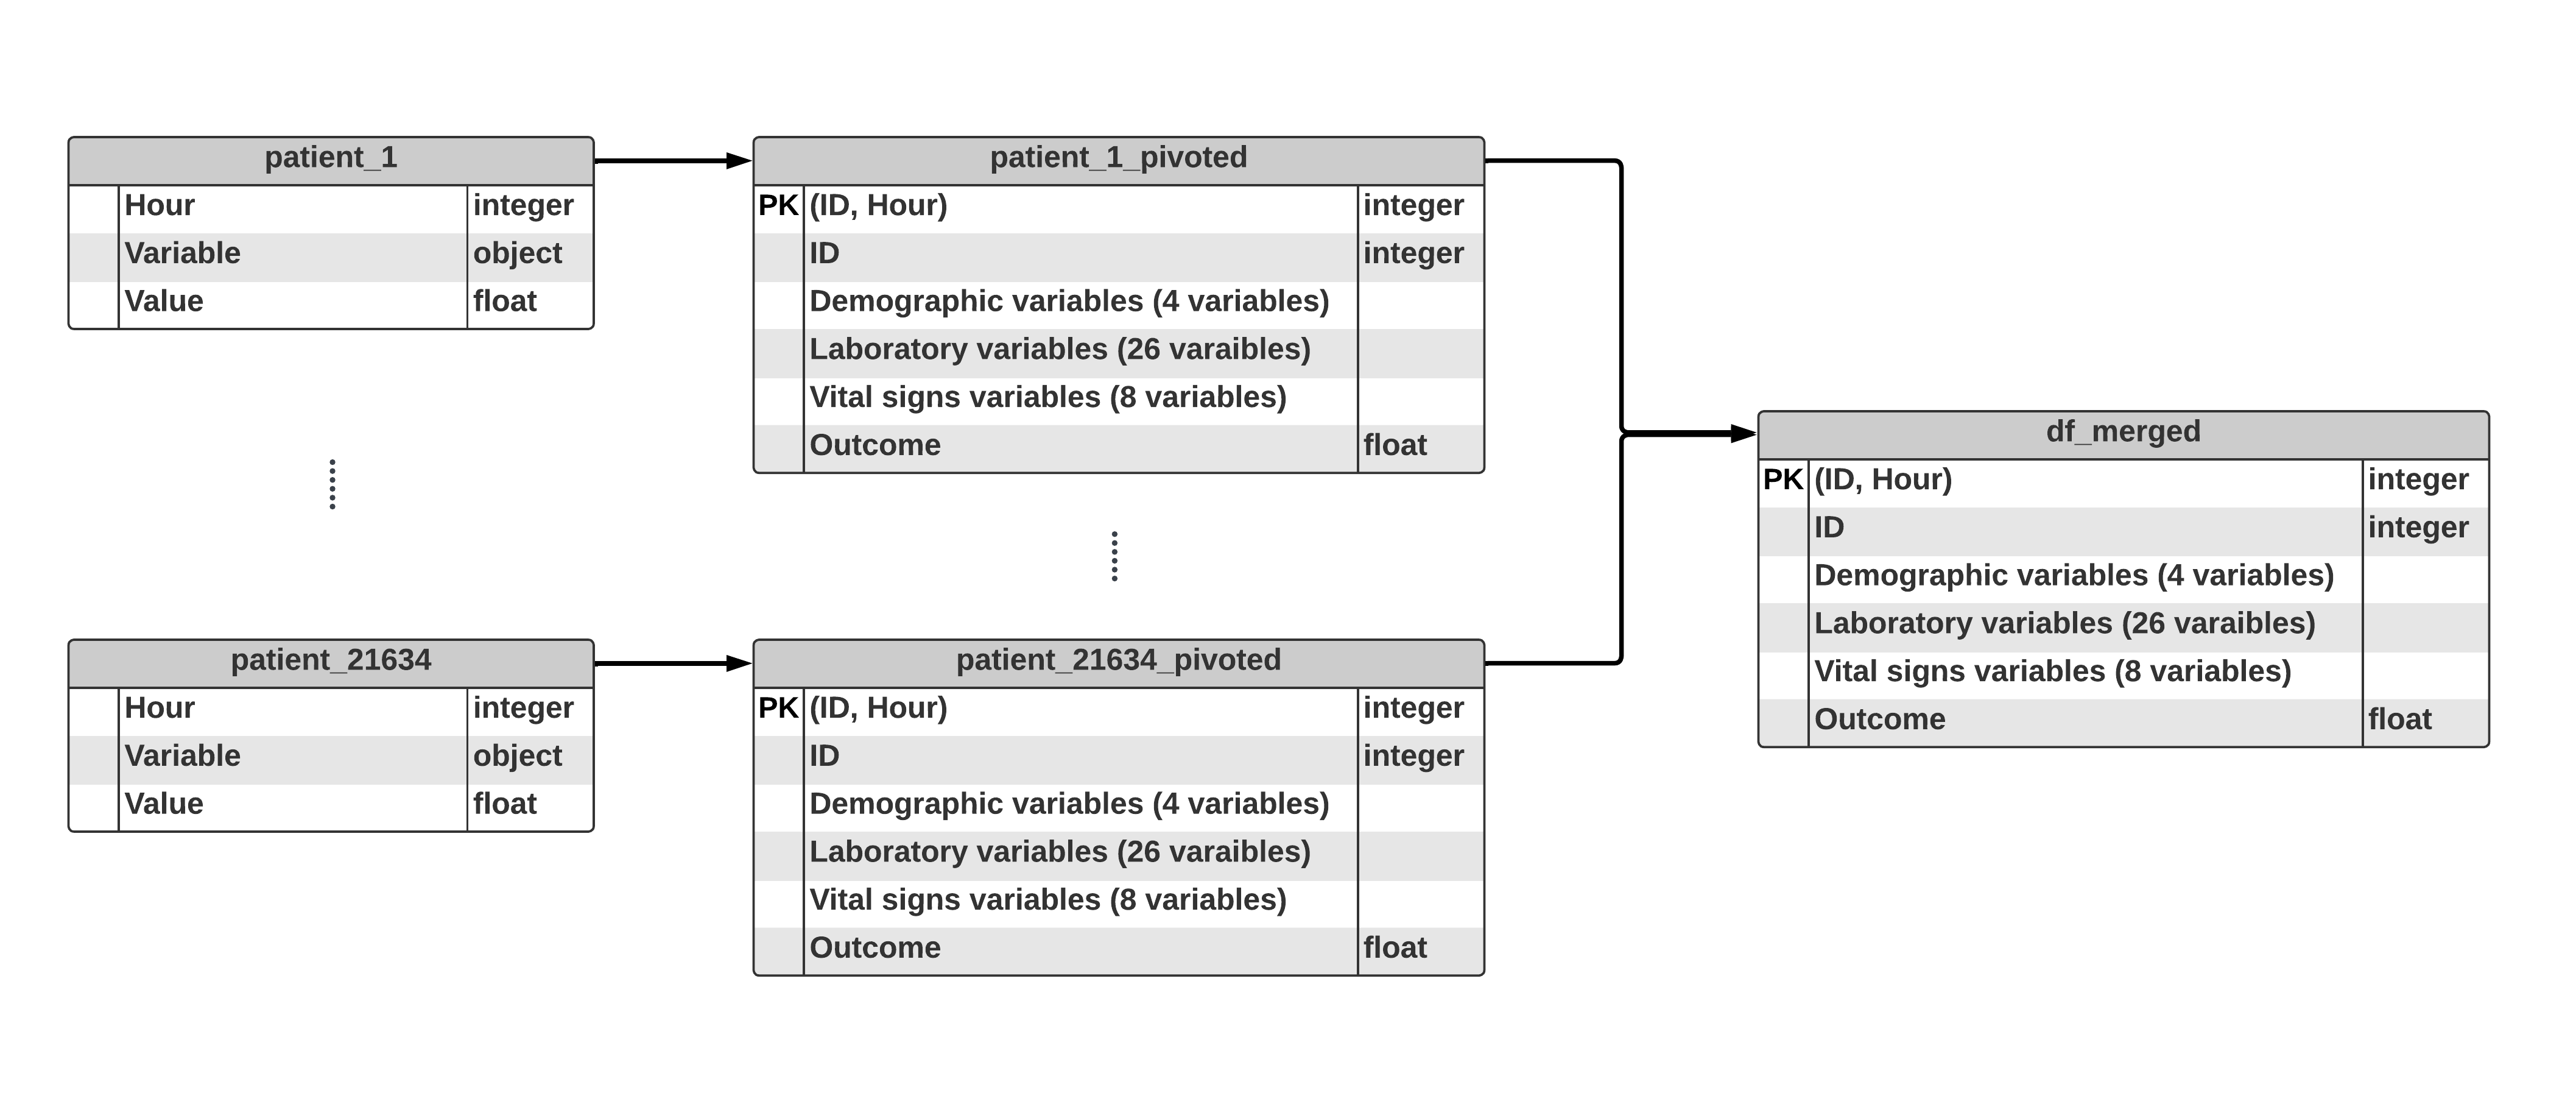
- This is the data for the ID 1 person.
patient_1_pivoted = pd.pivot_table(patient_1, columns = ["Variable"], index = ["Hour"], values = "Value").reset_index()
patient_1_pivoted
| Variable | Hour | Age | BUN | Creatinine | DBP | Gender | HR | Hct | Hgb | ID | MAP | Magnesium | O2Sat | Phosphate | Platelets | Potassium | Resp | SBP | Temp | WBC |
|---|---|---|---|---|---|---|---|---|---|---|---|---|---|---|---|---|---|---|---|---|
| 0 | 1 | 50.73 | NaN | NaN | NaN | 1.0 | NaN | NaN | NaN | 1.0 | NaN | NaN | NaN | NaN | NaN | NaN | NaN | NaN | NaN | NaN |
| 1 | 2 | 50.73 | NaN | NaN | 51.31 | 1.0 | 71.48 | NaN | NaN | NaN | 65.37 | NaN | 98.90 | NaN | NaN | NaN | 15.81 | 87.74 | 36.47 | NaN |
| 2 | 3 | 50.73 | NaN | NaN | 49.68 | 1.0 | 69.51 | NaN | NaN | NaN | NaN | NaN | NaN | NaN | NaN | NaN | 17.14 | 84.24 | NaN | NaN |
| 3 | 4 | 50.73 | NaN | NaN | 55.74 | 1.0 | 63.17 | NaN | NaN | NaN | 71.06 | NaN | 99.93 | NaN | NaN | NaN | 20.20 | 95.22 | NaN | NaN |
| 4 | 5 | 50.73 | 15.0 | 0.5 | 58.26 | 1.0 | 63.96 | 40.9 | 13.2 | NaN | 77.08 | 1.8 | 97.07 | 2.9 | 225.0 | 4.2 | 16.23 | 104.79 | NaN | 13.2 |
| 5 | 6 | 50.73 | NaN | NaN | 47.22 | 1.0 | 74.38 | NaN | NaN | NaN | 58.35 | NaN | 96.98 | NaN | NaN | NaN | 18.11 | 78.92 | 36.59 | NaN |
| 6 | 7 | 50.73 | NaN | NaN | 60.20 | 1.0 | 64.60 | NaN | NaN | NaN | 75.88 | NaN | 97.89 | NaN | NaN | NaN | NaN | 98.10 | NaN | NaN |
| 7 | 8 | 50.73 | NaN | NaN | NaN | 1.0 | 62.81 | NaN | NaN | NaN | 75.16 | NaN | 98.89 | NaN | NaN | NaN | 16.92 | 100.86 | NaN | NaN |
| 8 | 9 | 50.73 | NaN | NaN | 60.96 | 1.0 | 65.15 | NaN | NaN | NaN | 77.38 | NaN | 98.06 | NaN | NaN | NaN | 17.78 | 98.90 | NaN | NaN |
| 9 | 10 | 50.73 | NaN | NaN | NaN | 1.0 | 65.70 | NaN | NaN | NaN | 78.12 | NaN | 100.03 | NaN | NaN | NaN | 18.18 | 105.84 | NaN | NaN |
| 10 | 11 | 50.73 | NaN | NaN | 60.41 | 1.0 | 70.27 | NaN | NaN | NaN | 75.46 | NaN | 98.90 | NaN | NaN | NaN | 17.90 | 99.20 | NaN | NaN |
| 11 | 12 | 50.73 | NaN | NaN | 78.62 | 1.0 | 66.54 | NaN | NaN | NaN | 91.58 | NaN | 97.92 | NaN | NaN | NaN | 17.78 | 112.28 | NaN | NaN |
| 12 | 13 | 50.73 | NaN | NaN | 70.29 | 1.0 | 64.09 | NaN | NaN | NaN | 82.81 | NaN | 97.02 | NaN | NaN | NaN | NaN | NaN | NaN | NaN |
| 13 | 14 | 50.73 | NaN | NaN | 64.40 | 1.0 | 64.32 | NaN | NaN | NaN | 92.72 | NaN | 99.03 | NaN | NaN | NaN | 24.02 | 138.79 | 35.97 | NaN |
| 14 | 15 | 50.73 | NaN | NaN | 68.98 | 1.0 | 81.82 | NaN | NaN | NaN | 79.62 | NaN | 97.95 | NaN | NaN | NaN | 15.24 | 104.85 | NaN | NaN |
| 15 | 16 | 50.73 | NaN | NaN | 70.66 | 1.0 | 71.66 | NaN | NaN | NaN | 81.11 | NaN | 97.95 | NaN | NaN | NaN | 15.05 | 103.13 | NaN | NaN |
| 16 | 17 | 50.73 | NaN | NaN | 65.39 | 1.0 | 73.84 | NaN | NaN | NaN | 76.73 | NaN | 96.09 | NaN | NaN | NaN | 14.87 | 94.28 | NaN | NaN |
- This table is the pivoted table of the original data of the ID 1 person.
- Variables for ID 1 are measured during 17 hours.
num_files = len(os.listdir("../data/x_all/"))
print("Total number of data file: ", num_files)
Total number of data file: 21634
- There are total 21,634 data files like above. So let’s make a conbined dataframe.
df = pd.DataFrame()

for i in range(num_files):
    patient = pd.read_csv(f"../data/x_all/{i + 1}.txt")

    id = int(patient.loc[patient["Variable"] == "ID", "Value"].values[0])

    patient_pivoted = pd.pivot_table(patient, columns = ["Variable"], index = ["Hour"], values = "Value").reset_index()
    patient_pivoted["ID"] = id

    df = pd.concat([df, patient_pivoted])
df.shape
(813177, 40)
-
Total data has shape (813,177, 40).
-
Let’s merge the outcome column.
train_outcome = pd.read_csv("../data/train_outcome.csv")
test_outcome = pd.read_csv("../data/test_outcome.csv")
outcome = pd.concat([train_outcome, test_outcome])
df = df.merge(outcome, how = "left", on = "ID")
df.shape
(813177, 41)
- Save the processed data to csv file.
df.to_csv("../data/df_merged.csv", index = False)
Summary