2 - 2) EDA - Demographic variables
import pandas as pd
import numpy as np

import os

import matplotlib.pyplot as plt
import matplotlib.patches as mpatches
import seaborn as sns
import missingno as msno
from utils import my_histogram, make_stacked_table, my_stacked_barplot
import warnings
warnings.filterwarnings('ignore')
pd.set_option('display.max_columns', None)
df_train = pd.read_csv("../data/df_train.csv")
df_test = pd.read_csv("../data/df_test.csv")
- There are 4 demographic variables.
- Age: Years (100 for patients 90 or above)
- Gender: Female (0) or Male (1)
- Unit1: Administrative identifier for ICU unit (MICU)
- Unit2: Administrative identifier for ICU unit (SICU)
1. Age
df_train.Age.isna().sum()
11592
df_test.Age.isna().sum()
5008
- There are 11,592, 5008 missing values in the Age variable from the train and the test data.
- If the ID is same, then the Age should be same. So let’s fill the missing age with the known age value from differnet row of the same ID.
df_train["Age"] = df_train.groupby("ID")["Age"].transform(lambda v: v.ffill())
df_train["Age"] = df_train.groupby("ID")["Age"].transform(lambda v: v.bfill())

df_test["Age"] = df_test.groupby("ID")["Age"].transform(lambda v: v.ffill())
df_test["Age"] = df_test.groupby("ID")["Age"].transform(lambda v: v.bfill())
df_train.Age.isna().sum()
0
df_test.Age.isna().sum()
0
grouped_age = pd.DataFrame(df_train.groupby("ID").mean().Age)
grouped_age.columns = ["Age"]

grouped_age.describe()
| Age | |
|---|---|
| count | 15144.000000 |
| mean | 61.615115 |
| std | 16.435411 |
| min | 13.770000 |
| 25% | 51.190000 |
| 50% | 63.325000 |
| 75% | 73.970000 |
| max | 100.990000 |
my_histogram(grouped_age, "Age")
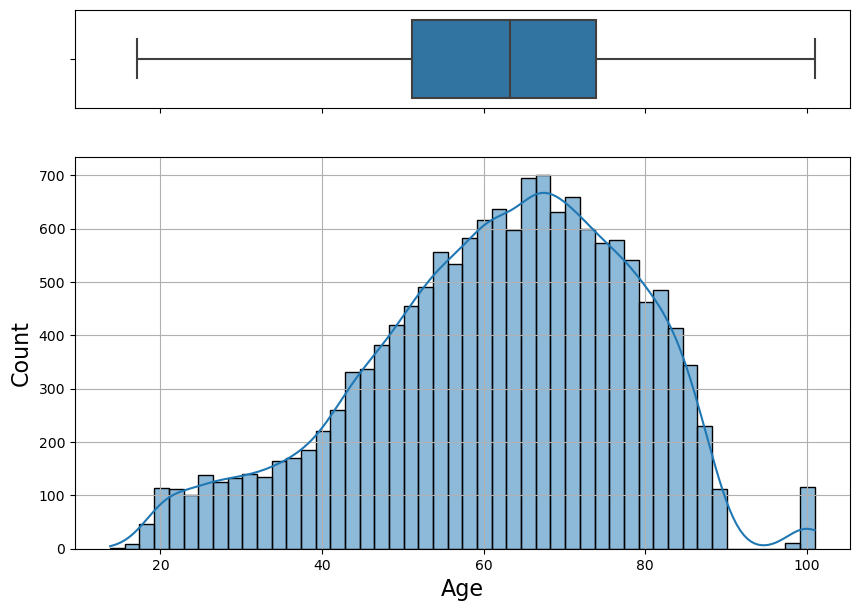
- Minimum age is 13 and maximum age is 100.
- Mean age is 61, median age is 63.
- Age distribution is slightly left-skewed.
Q. Does the age distribution differ according to outcome?
sns.histplot(data = df_train[["ID", "Age", "Outcome"]].drop_duplicates(),
             x = "Age", hue = "Outcome")
<AxesSubplot:xlabel='Age', ylabel='Count'>

- It seems that outcome = 1 group and outcome = 0 group have the similar age distribution.
2. Gender
df_train.Gender.isna().sum()
11592
df_test.Gender.isna().sum()
5008
- There are 11,592, 5,008 missing values in the Gender variable from the train and the test data.
- If the ID is same, then the Gender should be same. So let’s fill the missing gender with the known gender value from differnet row of the same ID.
df_train["Gender"] = df_train.groupby("ID")["Gender"].transform(lambda v: v.ffill())
df_train["Gender"] = df_train.groupby("ID")["Gender"].transform(lambda v: v.bfill())

df_test["Gender"] = df_test.groupby("ID")["Gender"].transform(lambda v: v.ffill())
df_test["Gender"] = df_test.groupby("ID")["Gender"].transform(lambda v: v.bfill())
df_train.Gender.isna().sum()
0
df_test.Gender.isna().sum()
0
sns.countplot(x = df_train[["ID", "Gender"]].drop_duplicates().Gender)
<AxesSubplot:xlabel='Gender', ylabel='count'>
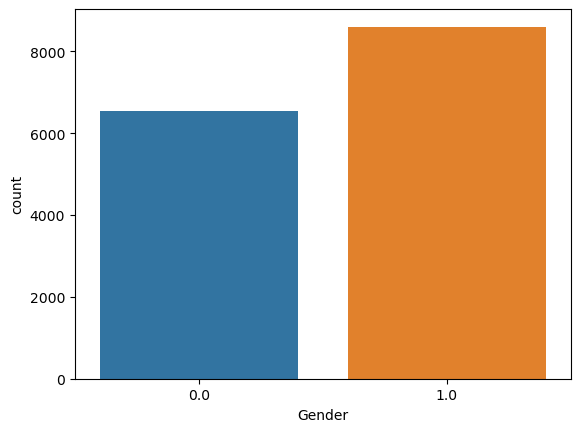
- There are about 2,000 more males than females.
Q. Is there a relationship between gender and outcomes?
temp = make_stacked_table(df_train[["ID", "Gender", "Outcome"]].drop_duplicates(), "Gender", "Outcome", "ID")
temp
| Gender | 0 | 1 | total | ratio | |
|---|---|---|---|---|---|
| 0 | 1.0 | 7357 | 1248 | 14714 | 0.08 |
| 1 | 0.0 | 5722 | 817 | 11444 | 0.07 |
my_stacked_barplot(temp, "Gender", "Outcome", 1.0)
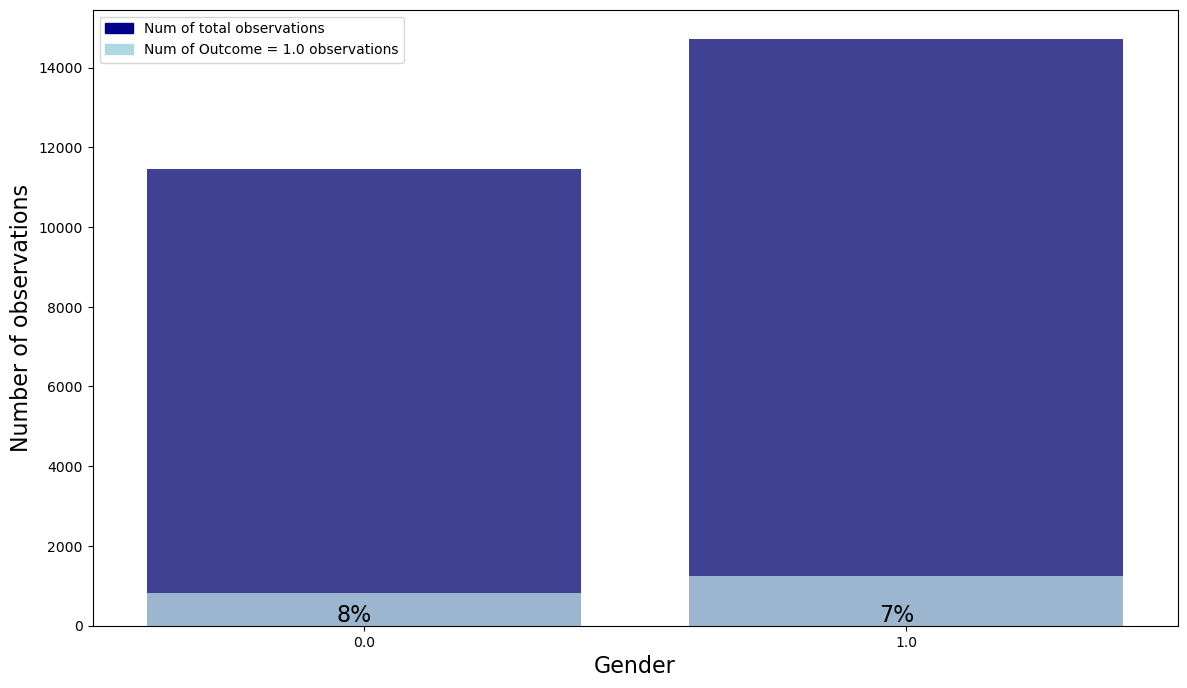
- Regardless of gender, there are about 8% of sepsis patients in each gender.
- It seems that gender is not related to the outcome.
3. Unit1, Unit2
df_train.Unit1.unique()
array([nan, 0., 1.])
- Unit1 variables means wheter the patient has stayed in MICU
- Unit2 variables means wheter the patient has stayed in SICU
(df_train.Unit1 + df_train.Unit2).unique()
array([nan, 1.])
- The sum of unit1 and unit2 is 1.
- That is, all patients stayed in either unit1 or unit2.
np.sum(df_train[["ID", "Unit1"]].drop_duplicates().dropna().groupby(["ID"]).count() != 1)
Unit1    0
dtype: int64
np.sum(df_train[["ID", "Unit2"]].drop_duplicates().dropna().groupby(["ID"]).count() != 1)
Unit2    0
dtype: int64
- Each patient has unique Unit1 and Unit2 value.
- SO, if the ID is same, then the Unit1 and the Unit2 should be same. So let’s fill the missing Unit with the known Unit value from differnet row of the same ID.
# Impute the missing values from the Unit1 variable

df_train["Unit1"] = df_train.groupby("ID")["Unit1"].transform(lambda v: v.ffill())
df_train["Unit1"] = df_train.groupby("ID")["Unit1"].transform(lambda v: v.bfill())

df_test["Unit1"] = df_test.groupby("ID")["Unit1"].transform(lambda v: v.ffill())
df_test["Unit1"] = df_test.groupby("ID")["Unit1"].transform(lambda v: v.bfill())

# Impute the missing values from the Unit2 variable
df_train["Unit2"] = df_train.groupby("ID")["Unit2"].transform(lambda v: v.ffill())
df_train["Unit2"] = df_train.groupby("ID")["Unit2"].transform(lambda v: v.bfill())

df_test["Unit2"] = df_test.groupby("ID")["Unit2"].transform(lambda v: v.ffill())
df_test["Unit2"] = df_test.groupby("ID")["Unit2"].transform(lambda v: v.bfill())
len(df_train[df_train.Unit1.isna()].ID.unique())
5883
len(df_train[df_train.Unit2.isna()].ID.unique())
5883
len(df_train[(df_train.Unit1.isna() & df_train.Unit2.isna())].ID.unique())
5883
- 5,883 patiens out of the total 15,144 patiens have missing values in both unit1 and unit2.
fig, axes = plt.subplots(1, 2, figsize = (12, 5))

sns.countplot(x = df_train[["ID", "Unit1"]].drop_duplicates().Unit1, ax = axes[0])
axes[0].set_title("Unit1", fontsize = 15)

sns.countplot(x = df_train[["ID", "Unit2"]].drop_duplicates().Unit2, ax = axes[1])
axes[1].set_title("Unit2", fontsize = 15)
Text(0.5, 1.0, 'Unit2')

- Unit1 and Unit2 are evenly distributed.
Q. Is there a relationship between unit and outcomes?
temp = make_stacked_table(df_train[["ID", "Unit1", "Outcome"]].drop_duplicates(), "Unit1", "Outcome", "ID")
temp
| Unit1 | 0 | 1 | total | ratio | |
|---|---|---|---|---|---|
| 0 | 0.0 | 4158 | 454 | 8316 | 0.05 |
| 1 | 1.0 | 3998 | 651 | 7996 | 0.08 |
my_stacked_barplot(temp, "Unit1", "Outcome", 1.0)

- About 8% of patients staying in unit 1 and about 5% of patients staying in unit 2 had sepsis.
- However, for about 38% of patients, information on which unit they stayed was not available.
- So, let’s exclude the Unit1 and the Unit2 variables from the analysis.
df_train = df_train.drop("Unit1", axis = 1)
df_train = df_train.drop("Unit2", axis = 1)

df_test = df_test.drop("Unit1", axis = 1)
df_test = df_test.drop("Unit2", axis = 1)
- Save the modified tables.
df_train.to_csv("../data/df_train.csv", index = False)
df_test.to_csv("../data/df_test.csv", index = False)
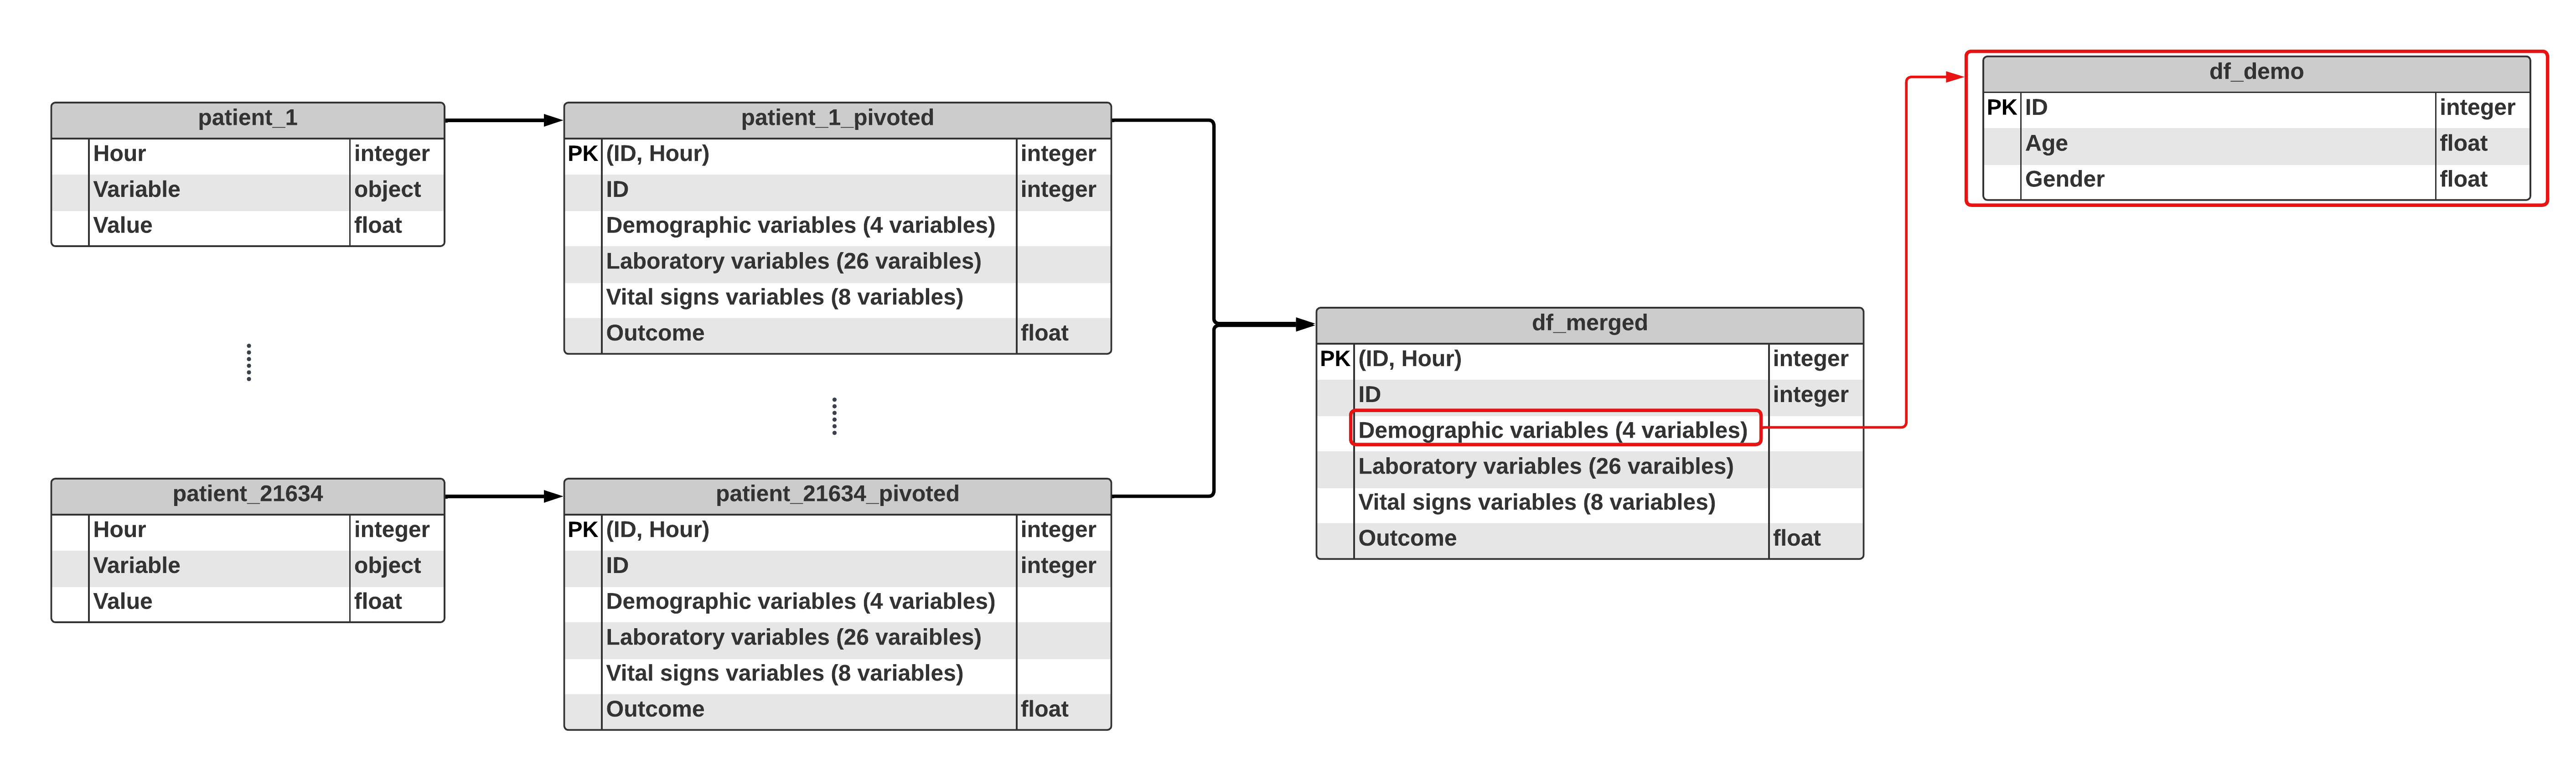
- Save the each ID’s distinct demographic variables (age and gender) into table.
df_train_demo = df_train[["ID", "Age", "Gender"]].drop_duplicates()
df_test_demo = df_test[["ID", "Age", "Gender"]].drop_duplicates()
- Save the tables.
df_train_demo.to_csv("../data/df_train_demo.csv", index = False)
df_test_demo.to_csv("../data/df_test_demo.csv", index = False)
df_train_demo.dtypes
ID          int64
Age       float64
Gender    float64
dtype: object
4. Summary