1) Dashboard Structure
5 minute read
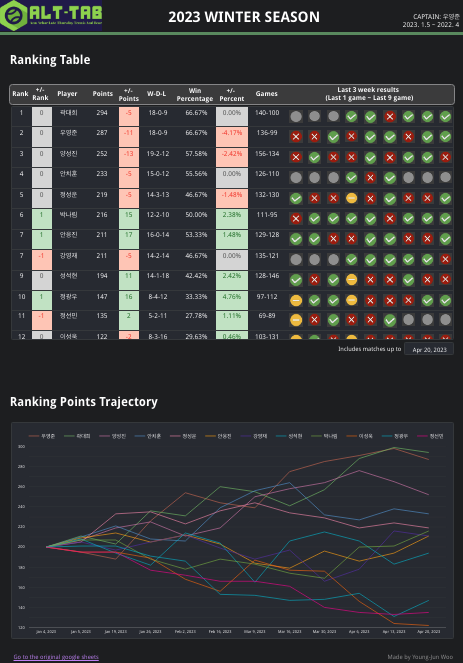 |
| Figure 1: Overall view of the ranking page |
- Ranking is the most important information in our club activities.
- Figure 2 is information about the rankings previously shown in the Excel sheet. It’s simple information, but it looks visually complicated because there are only numbers.
- Also, it was difficult to show various information related to rankings, such as cumulative wins/losses, win rates, and recent results.
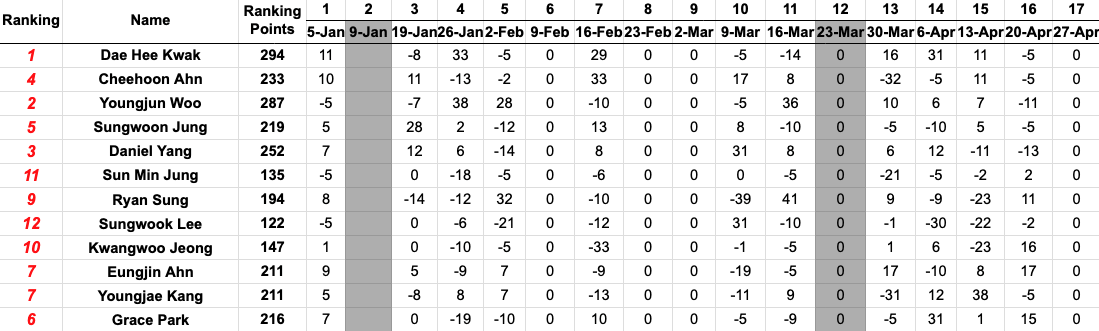 |
| Figure 2: Ranking point information from the previous Excel sheet |
- So, while looking for ranking & standing tables of various sports, I made a ranking table by referring to the following two sports.
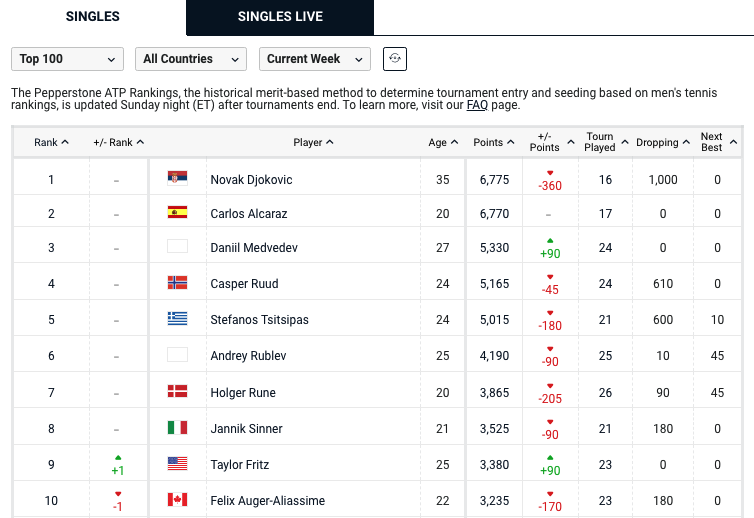 |
| Reference 1: ATP tennis players ranking table |
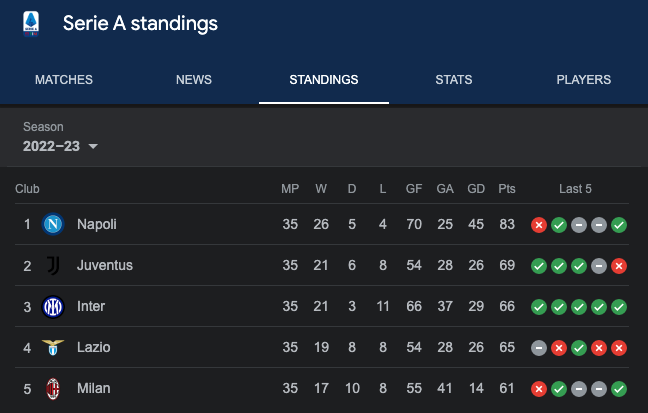 |
| Reference 2: Soccer league standing table |
- Figure 3 is the ranking table of the newly created dashboard. It shows more information intuitively and easily than the existing Excel sheet.
- It shows information such as cumulative win/draw/loss, win rate, change in win rate, cumulative number of games, and recent records that were not able to be shown in the existing Excel sheet.
- It is intuitively easy to understand by expressing the increase and decrease information compared to last week in color.
- Information is intuitive, simple and easy to understand.
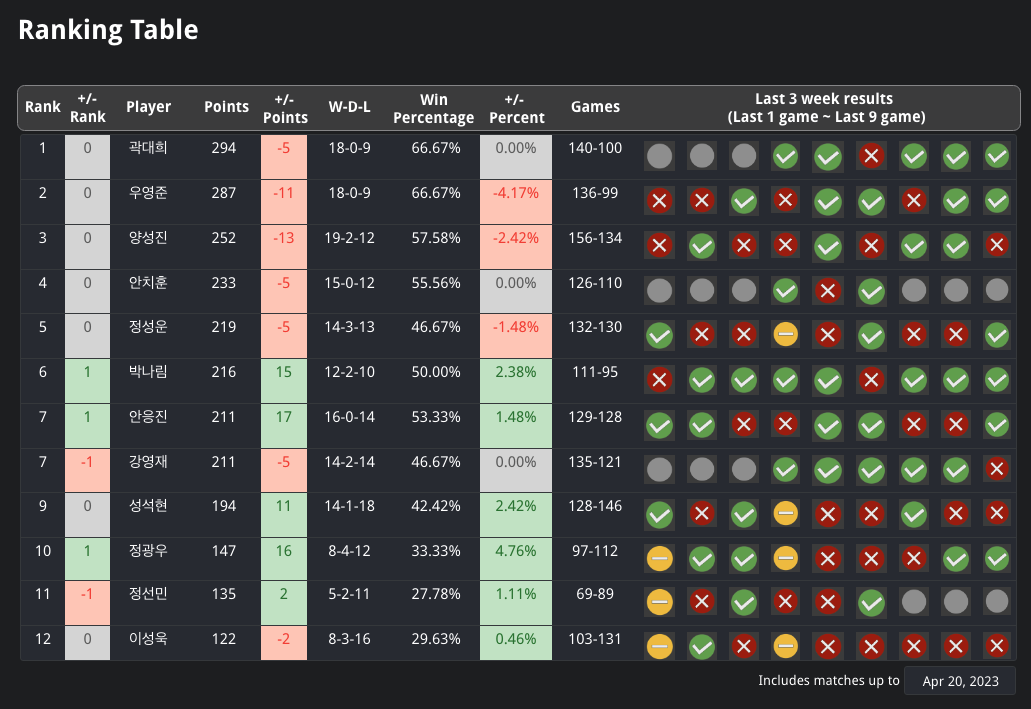 |
| Figure 3: Ranking table |
- In addition to the ranking table, the ranking point trajectory information in Figure 4 was also provided to help understand the ranking trend of each player more easily.
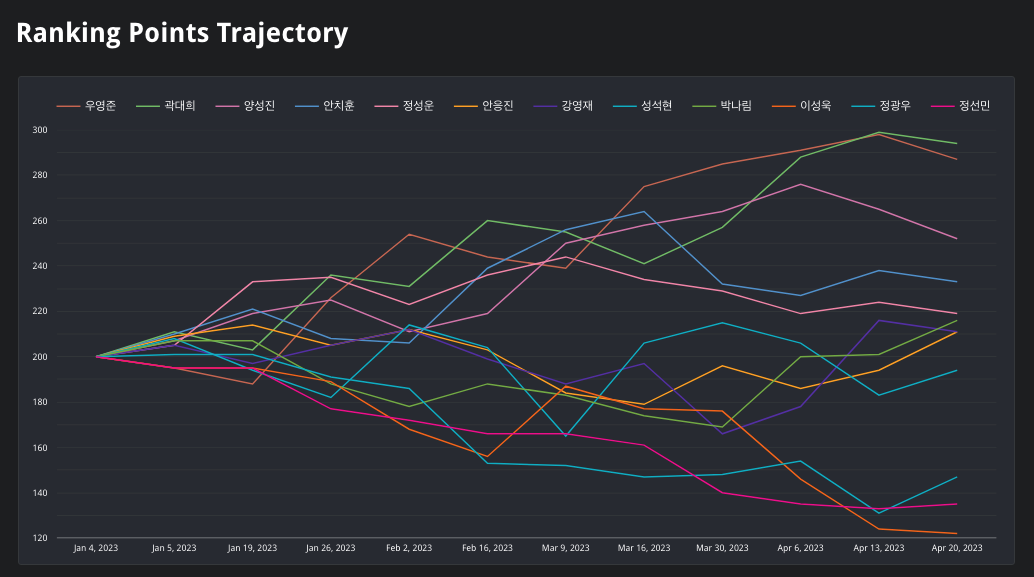 |
| Figure 4: Ranking points trajectory |
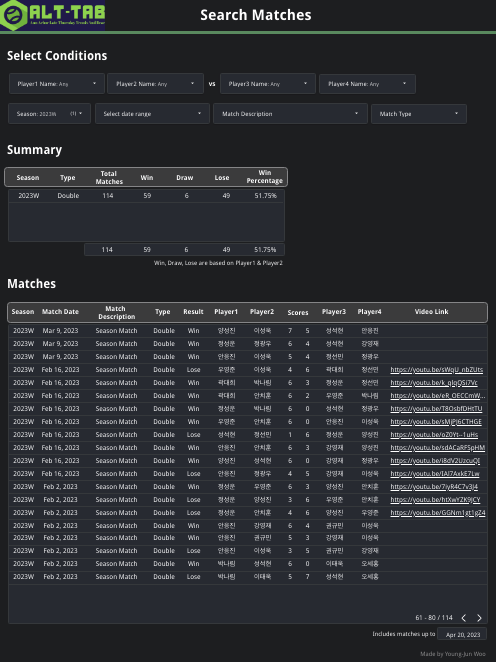 |
| Figure 5: Overall view of the search matches page |
- As shown in Figure 6, it was difficult to find past game results or summary information in the existing Excel sheet.
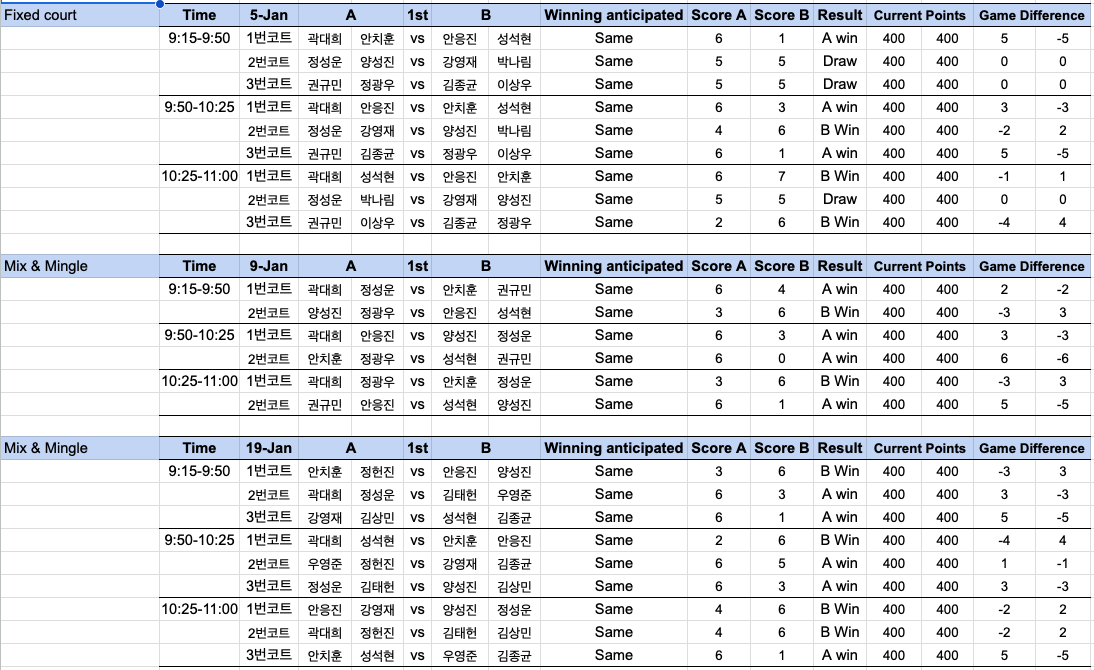 |
| Figure 6: Past match information from the previous Excel sheet |
- So, I created a search system that provides summary information (Figure 8) and detailed game records (Figure 9) of matches that match the conditions when searching for conditions such as player and season. (Figure 7)
- In addition, I tried to take as many match videos as possible and provide links to club players so that players could identify problems on their own or give feedback to each other through past match videos. (video link column from the Figure 7)
 |
| Figure 7: Select conditions part of search matches page |
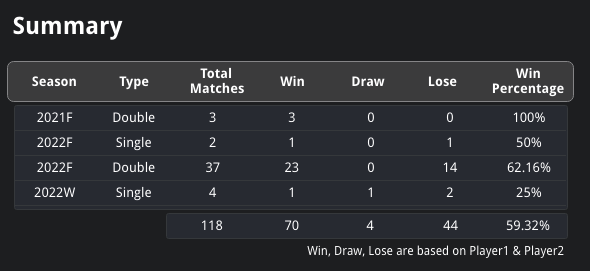 |
| Figure 8: Summary information of matches with selected conditions |
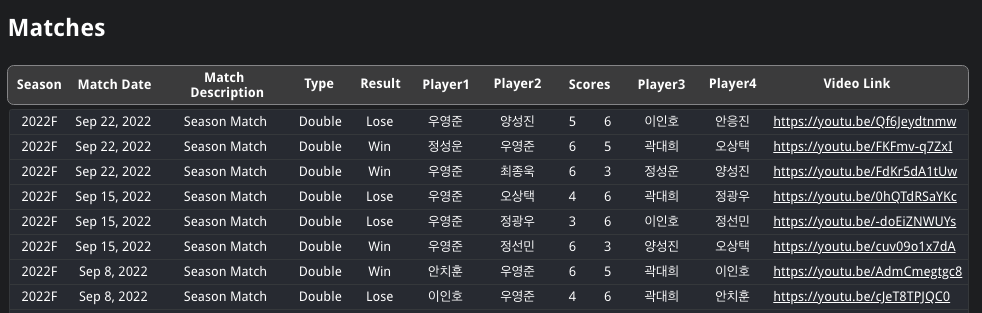 |
| Figure 9: Detailed game records of selected conditions |
- I judged that editing and uploading matche videos to YouTube was too time consuming, so I built a system that simply edits and uploads videos to my YouTube chanel using the YouTube Data API and Python. (Link to the github page)
- I tried to provide basic statistics that the existing Excel sheet could not provide.
- Figure 10 shows the win rate when each player was on the same team as the other players. Figure 11 also shows the win rate when each player was playing against other players.
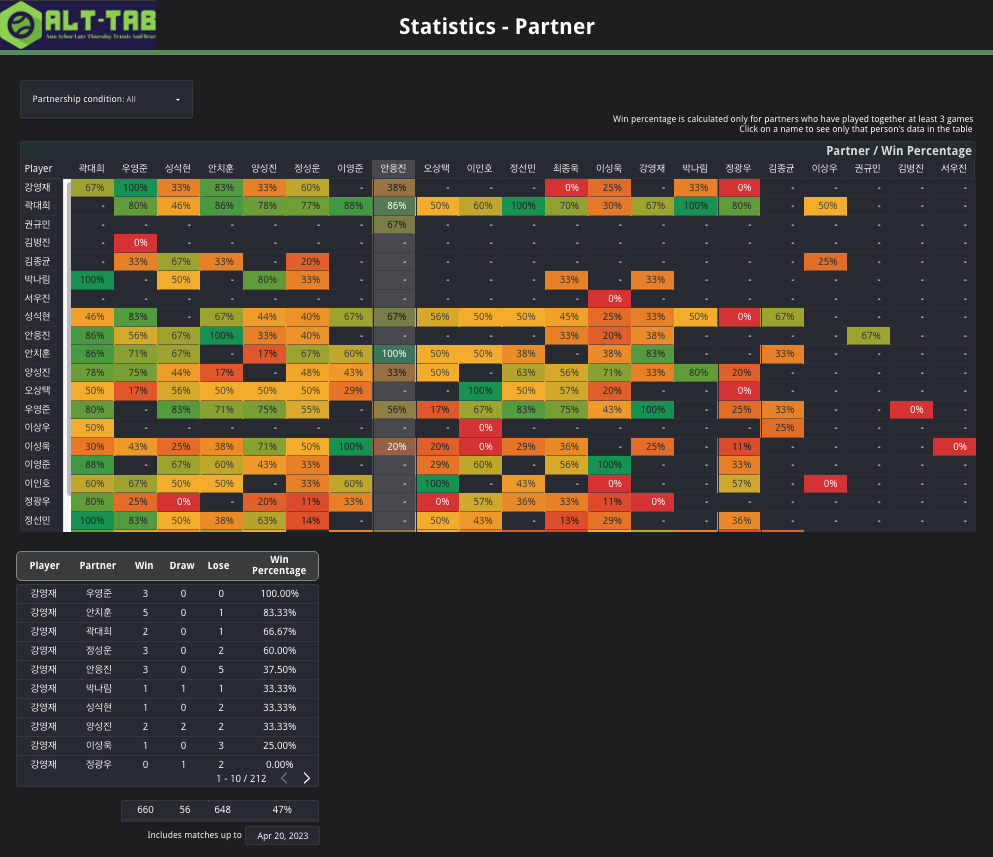 |
| Figure 10: Win rate with partners |
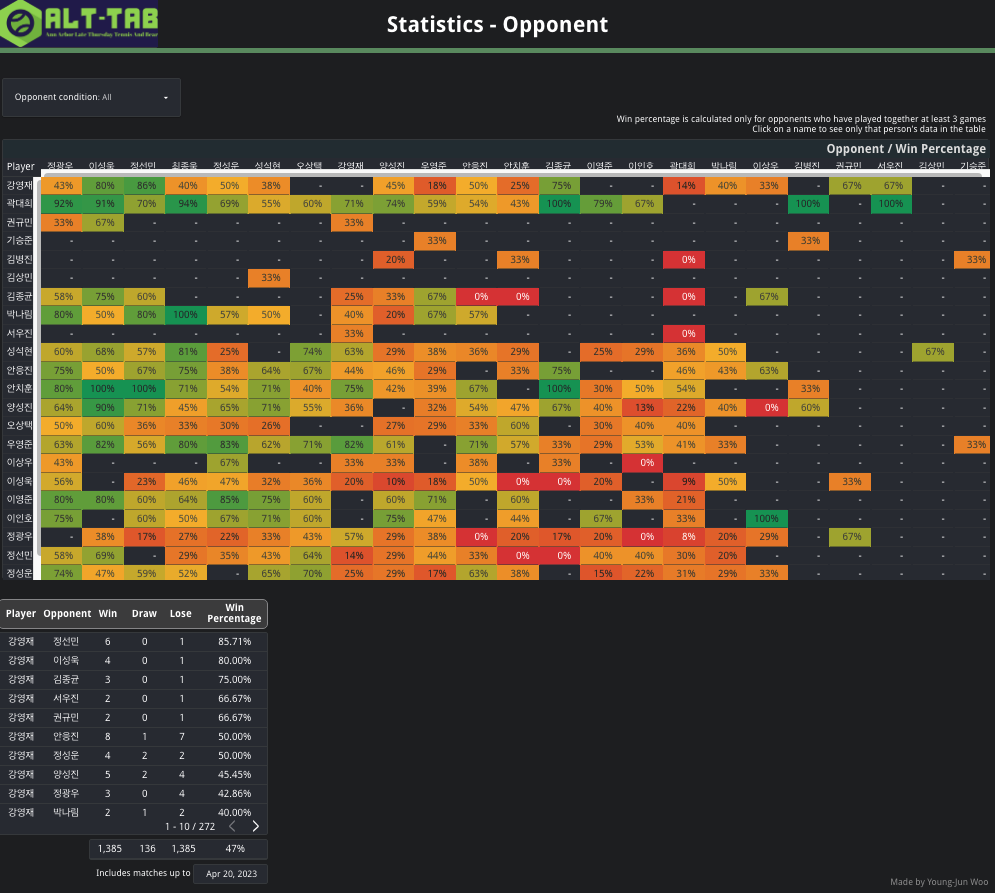 |
| Figure 11: Win rate with opponents |
- By showing information on the winners for each season, we wanted to draw out the competitive spirit of the players. (Figure 12)
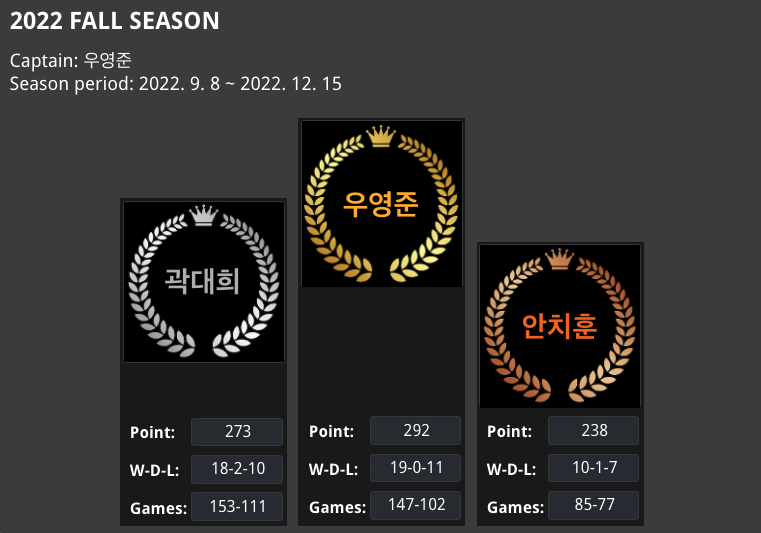 |
| Figure 12: Past season winners |
- In addition, ranking tables and ranking point trajectory information for past seasons are provided so that club players can find them. (Figure 13)
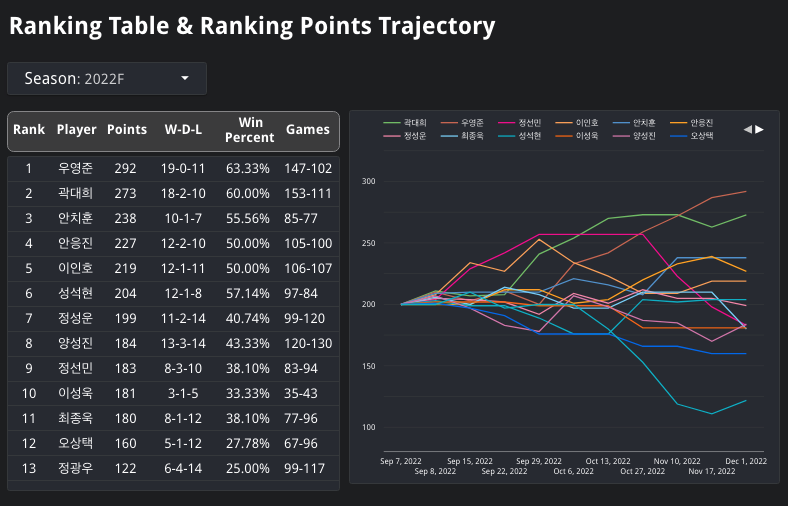 |
| Figure 13: Past season ranking table & ranking points trajectory |
